Receptor Occupancy: Why the Last Milligrams Are Hardest
⚕️ This article is education, not medical advice. Every claim is sourced below. Never stop or change medication without your prescriber — some medications are dangerous to stop abruptly.
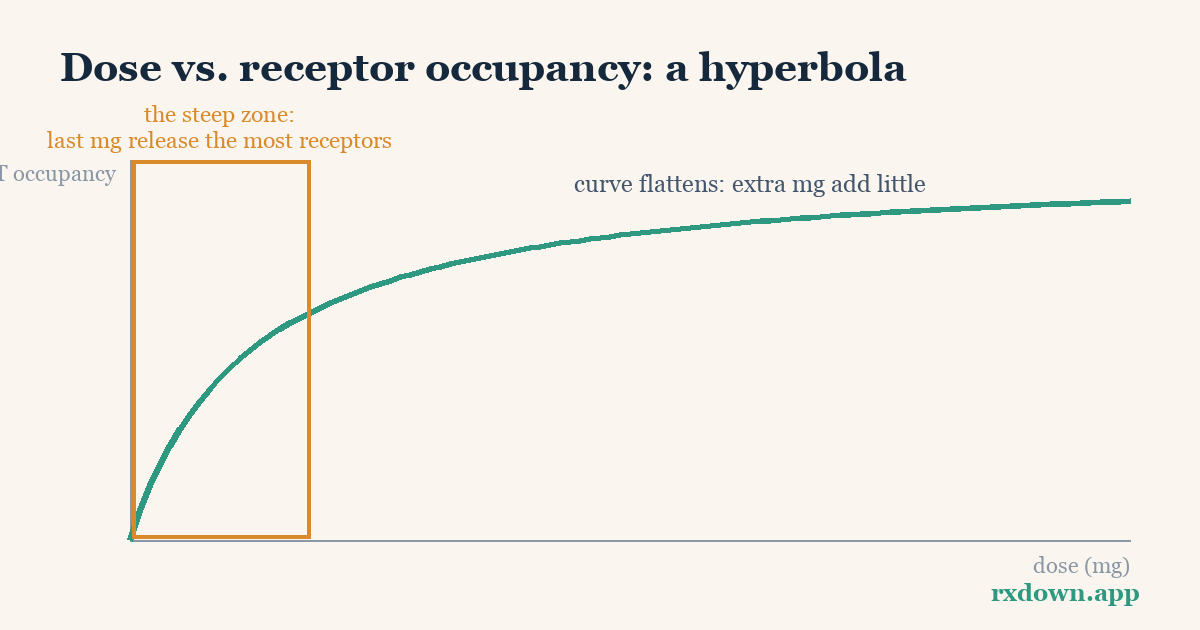
TL;DR: Receptor occupancy is the fraction of a drug’s target sites that are switched off at a given dose. For SSRIs, the target is the serotonin transporter (SERT), and PET brain scans show that a standard dose already blocks roughly 80% of it — so the relationship between dose and occupancy is hyperbolic, not linear. The first few milligrams claim the most receptors, which means an equal-milligram cut removes almost nothing near the top of the dose range but a great deal near the bottom. That single fact explains why the last few milligrams of a taper are so often the hardest, and why proportional (hyperbolic) reductions and tiny final doses matter.
This article is education, not medical advice. It describes published approaches and ranges; it never tells you what to take. Dose changes should be planned and supervised by your prescriber, and some medications are dangerous to stop abruptly. Numbers below are illustrative, from published studies, and vary between individuals.
What does “receptor occupancy” actually mean?
Most psychiatric drugs work by attaching to a specific protein in the brain. SSRIs attach to the serotonin transporter (SERT) — the molecular “pump” that normally recycles serotonin back into the neuron that released it. When a drug molecule sits on the transporter, that pump is blocked, so serotonin lingers longer in the synapse.
Occupancy is simply the percentage of those transporters that are blocked at a given dose. Zero percent means the pumps are all free; 100% would mean every pump is capped. It is measured directly in living brains using positron emission tomography (PET): researchers inject a tiny amount of a radioactive tracer that binds to unoccupied transporters, then measure how much tracer the drug displaces. More displacement means higher occupancy.
The key thing to hold onto is that occupancy is about the drug’s grip on its target, not the size of the tablet. A 20 mg tablet does not deliver “twice the effect” of a 10 mg tablet, because the two doses can occupy almost the same fraction of transporters. Understanding why leads directly to why tapering behaves the way it does.
What did the brain scans show?
The landmark measurement comes from Meyer and colleagues (2004, American Journal of Psychiatry), who used [11C]DASB PET to map SERT occupancy across five SSRIs at different doses. Their central finding: minimum therapeutic doses of SSRIs such as citalopram and paroxetine already produce about 80% serotonin transporter occupancy, and pushing the dose higher adds only a little more. Occupancy climbs steeply at low doses, then flattens into a plateau.
A later systematic review by Sørensen, Ruhé and Munkholm (2022, Molecular Psychiatry) pooled 17 PET and SPECT studies — 294 participants and 309 occupancy measurements across 10 antidepressants — and confirmed the same shape. In their words, occupancy “increased hyperbolically with increasing antidepressant dose in the lower dose-range, reaching a plateau at an occupancy of approximately 80% at roughly the usual minimum recommended dose.” For citalopram specifically, they fitted the curve with a half-maximal dose of about 3.4 mg (the dose producing half the maximum occupancy), with measured occupancy ranging from roughly 16% at 1 mg to about 87% at 60 mg.
Two honest caveats travel with these numbers. First, they are averages: individual scans scatter widely around the fitted line. Second, occupancy is a marker of engagement, not of therapeutic benefit — the plateau near 80% is one reason clinicians question whether very high doses add much, but it does not mean a person is “80% treated.”
Why do the first milligrams claim the most receptors?
The curve’s shape falls straight out of basic chemistry — the law of mass action. Drug molecules and transporter sites collide at random; a molecule binds, holds for a while, releases, and another takes its place. When almost all sites are empty (“open for business,” as Mark Horowitz puts it), nearly every added molecule finds a free site, so each milligram buys a lot of occupancy. As sites fill up, added molecules increasingly bump into already-occupied sites and do nothing extra. The transporter saturates.
Pharmacologists describe this with the Hill equation (here in its simplest one-to-one form, the Michaelis–Menten model the Sørensen review used):
occupancy ≈ maximum × dose ÷ (dose + K)
where K is the dose that fills half the sites. You do not need the algebra to feel the consequence. Because dose sits in both the top and bottom of that fraction, doubling a low dose moves occupancy a lot, while doubling a high dose barely moves it. Horowitz uses a plain-language image in a 2024 Carlat Report interview: turning down a loud concert from very loud to slightly-less-loud is barely noticeable, but the last few notches toward silence are where you actually hear the room change. The receptors behave the same way.
This is also why small doses are deceptively strong. As Horowitz notes, “2 mg of citalopram sounds like a homeopathic dose, but it has about half the effect of 20 mg on the serotonin transporter” (paraphrasing Horowitz & Taylor, 2019). A dose that looks trivial on the label can still be doing real biological work.
A worked example: two ways to halve citalopram
Put numbers on it. The table below combines directly measured anchor points (1 mg, 20 mg, 60 mg, from Meyer 2004 and the Sørensen 2022 review) with intermediate values estimated from that same published hyperbolic model for citalopram (half-maximal dose ≈ 3.4 mg). Treat every figure as approximate — a smooth stand-in for messy individual data.
| Citalopram daily dose | Approx. SERT occupancy |
|---|---|
| 1 mg | ~16–20% |
| 2.5 mg | ~40% |
| 5 mg | ~55–60% |
| 10 mg | ~70% |
| 20 mg (usual minimum effective dose) | ~80% |
| 40 mg | ~86% |
| 60 mg | ~87% |
Sources: measured points from Meyer et al. (2004) and Sørensen et al. (2022); intermediate values estimated from the published citalopram dose–occupancy curve (K ≈ 3.4 mg). Individual results vary.
Now compare two dose halvings:
- 20 mg → 10 mg (a 10 mg cut): occupancy falls from about 80% to about 70% — roughly a 10-point drop.
- 5 mg → 2.5 mg (a 2.5 mg cut): occupancy falls from about 56% to about 40% — roughly a 16-point drop.
The second reduction removes four times less drug (2.5 mg versus 10 mg) yet takes away more transporter occupancy. To your nervous system, the small cut at the bottom is the bigger event. That inversion — where less milligram equals more biological change — is the whole reason the tail of a taper feels disproportionately hard.
Why do equal-milligram cuts get harder as you go?
If halving looks uneven, fixed-milligram steps are dramatically worse. Watch what one repeated 5 mg cut does at different points on the citalopram curve:
| Fixed 5 mg cut | Occupancy before → after | Change |
|---|---|---|
| 40 mg → 35 mg | ~86% → ~84% | ~2 points |
| 20 mg → 15 mg | ~80% → ~77% | ~3 points |
| 10 mg → 5 mg | ~70% → ~56% | ~14 points |
| 5 mg → 0 mg | ~56% → 0% | ~56 points |
Illustrative, from the same published curve; individual results vary.
The identical 5 mg step is nearly nothing at the top and a cliff at the bottom. A person who tapered comfortably by 5 mg every couple of weeks can hit a wall the moment those same steps start landing on the steep part of the curve — which is exactly where a linear schedule dumps the biggest occupancy changes into the final reductions. Horowitz summarizes it bluntly: the last few milligrams can be harder than all the preceding reductions combined.
The fix is to reduce by a roughly constant share of occupancy, which means shrinking the milligram steps as the dose falls. Because occupancy is hyperbolic in dose, even reductions in occupancy require exponentially smaller dose cuts — this is the reasoning behind hyperbolic tapering, laid out by Horowitz & Taylor (2019, Lancet Psychiatry). Proportional-by-dose cuts (halving) are already far more even than fixed-milligram cuts, and true occupancy-targeted schedules go a step further. Our companion hyperbolic tapering guide walks through how those step sizes are calculated, and the taper calculator applies the same math to common medications.
What does this mean at the tail of a taper?
Several practical consequences follow, all of them downstream of the curve rather than of anyone’s willpower.
Tiny doses are not trivial doses. A 1 mg dose of citalopram still occupies roughly a fifth of the transporter (Maudsley Deprescribing Guidelines, 2024). Jumping from a small tablet straight to zero can therefore remove more occupancy in one step than several earlier reductions did — the opposite of what the milligram number suggests. This is a big part of why withdrawal symptoms so often cluster at the very end.
Final steps usually need to shrink. Published schedules reflect this. In the Carlat interview, Horowitz describes reducing an SSRI by 10–20% of the current dose early on, then switching to progressively smaller cuts near the bottom — with some people going as slowly as 5% of their last dose per month. The exact schedule is individual and belongs with your prescriber; the pattern is the point.
Formulation becomes the limiting factor. Standard tablets often cannot be split finely enough to make sub-milligram steps. Published options include liquid formulations, compounded low-dose capsules, and pharmacy tapering strips (daily pouches that step down gradually). In a 2021 cohort study of tapering-strip users — most of whom had previously been unable to stop — 72% successfully discontinued their antidepressant (Groot & van Os, Therapeutic Advances in Psychopharmacology). That is observational, patient-reported data, not a randomized trial, so read it as encouraging real-world signal rather than proof; but it lines up with what the occupancy curve predicts about the value of small final steps.
If you experience withdrawal, several published guides describe holding at a dose or reinstating until symptoms settle before continuing — see also our antidepressant withdrawal timeline for what those symptoms can look like over time.
Where does the occupancy model fall short?
The hyperbolic occupancy curve is a powerful mechanistic explanation, but it is not the whole story of withdrawal — and treating it as one would be a mistake.
- Occupancy is not withdrawal. The curve describes how much transporter a dose blocks right now. Withdrawal is driven by the brain’s slow adaptation to a drug being present, and by how slowly that adaptation reverses when the drug is removed. Horowitz’s concert analogy captures it: your ears adjust to a loud room, and re-adjusting to quiet takes time. Neuroimaging suggests some serotonin-system changes can persist well beyond the drug’s exit from the body — by one account, altered receptor sensitivity has been observed for up to several years after long-term antidepressant use (Horowitz, Carlat interview, 2024, citing neuroimaging studies).
- Different receptors, different curves. Occupancy math applies to any drug and its target, but the numbers are drug-specific. Benzodiazepines act at GABA-A receptors; Z-drugs and orexin-blocking DORA sleep medications have their own binding profiles. The shape (hyperbolic) generalizes; the exact percentages do not transfer between drugs.
- Big individual variation. The published curves are population averages with wide scatter. Genetics, metabolism, other medications, duration of use, and personal history all shift where a given person sits. Some tolerate faster reductions; others need schedules far slower than any table.
- Symptoms — not the curve — steer the taper. The occupancy model predicts where trouble is likely (the steep low-dose region). It cannot tell you how fast you can go. That is why clinicians track lived symptoms and adjust pace accordingly, and why distinguishing withdrawal from relapse (they can look alike but call for opposite responses) matters throughout.
In short: occupancy explains the terrain of a taper — why it steepens near the end — without dictating the speed. It is a map, not an itinerary.
Keeping a record makes the pattern visible
Because the hard stretch tends to arrive at low doses, a day-by-day record of dose, sleep, and symptoms is what turns “this feels worse” into a clear picture you and your prescriber can act on. A diary like RxDown logs each step and can generate a doctor-ready report, so decisions about slowing down, holding, or reaching for a liquid formulation rest on your actual data rather than memory. When you are ready to talk it through, our guide on talking to your doctor about deprescribing and the FAQ can help you prepare.
Sources
- Meyer JH, Wilson AA, Sagrati S, et al. Serotonin transporter occupancy of five selective serotonin reuptake inhibitors at different doses: an [11C]DASB positron emission tomography study. American Journal of Psychiatry. 2004;161(5):826–835.
- Horowitz MA, Taylor D. Tapering of SSRI treatment to mitigate withdrawal symptoms. Lancet Psychiatry. 2019;6(6):538–546.
- Sørensen A, Ruhé HG, Munkholm K. The relationship between dose and serotonin transporter occupancy of antidepressants — a systematic review. Molecular Psychiatry. 2022;27(1):192–201.
- Horowitz MA, Taylor D. The Maudsley Deprescribing Guidelines: Antidepressants, Benzodiazepines, Gabapentinoids and Z-drugs. Wiley-Blackwell; 2024.
- Groot PC, van Os J. Successful use of tapering strips for hyperbolic reduction of antidepressant dose: a cohort study. Therapeutic Advances in Psychopharmacology. 2021;11.
- Horowitz MA (interview). How to stop a psychiatric med. The Carlat Psychiatry Report. 2024;22(11–12).
Frequently asked questions
Why are the last few milligrams of a taper the hardest?
Because dose and serotonin transporter (SERT) occupancy follow a hyperbolic curve, not a straight line. At standard doses most transporters are already blocked, so cutting milligrams changes occupancy very little; at very low doses each milligram controls a large share of what is left, so the same size cut produces a much bigger biological change. This is why many people find the final small doses harder to get through than every earlier reduction combined.
Does 80% receptor occupancy mean an SSRI is '80% effective'?
No. Occupancy measures how much of the serotonin transporter a drug blocks, not how well it treats depression. PET studies (Meyer et al., 2004) found roughly 80% SERT occupancy at standard SSRI doses, but occupancy is only a marker of drug engagement. Clinical response, side effects, and withdrawal depend on many downstream adaptations the occupancy curve does not capture.
Why might a liquid or compounded formulation help at the end of a taper?
Because occupancy changes steeply at low doses, stepping from a small tablet straight to zero can remove a large share of transporter occupancy in a single jump. Liquids, tapering strips, and compounded doses let people make very small reductions — fractions of a milligram — that standard tablets cannot. Any such change should be planned with a prescriber and pharmacist.
Tracking your dose, sleep, and symptoms makes every conversation in this article easier. RxDown is a free diary built for exactly that. Get RxDown · Free taper calculator